Bitcoin (BTC) Price Analysis – 1D Chart on March 17
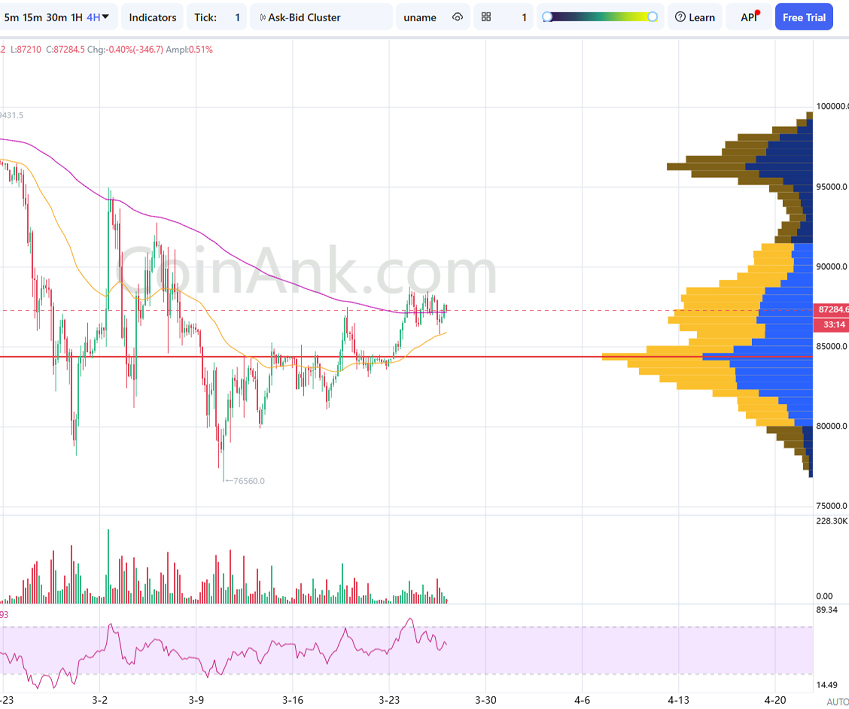
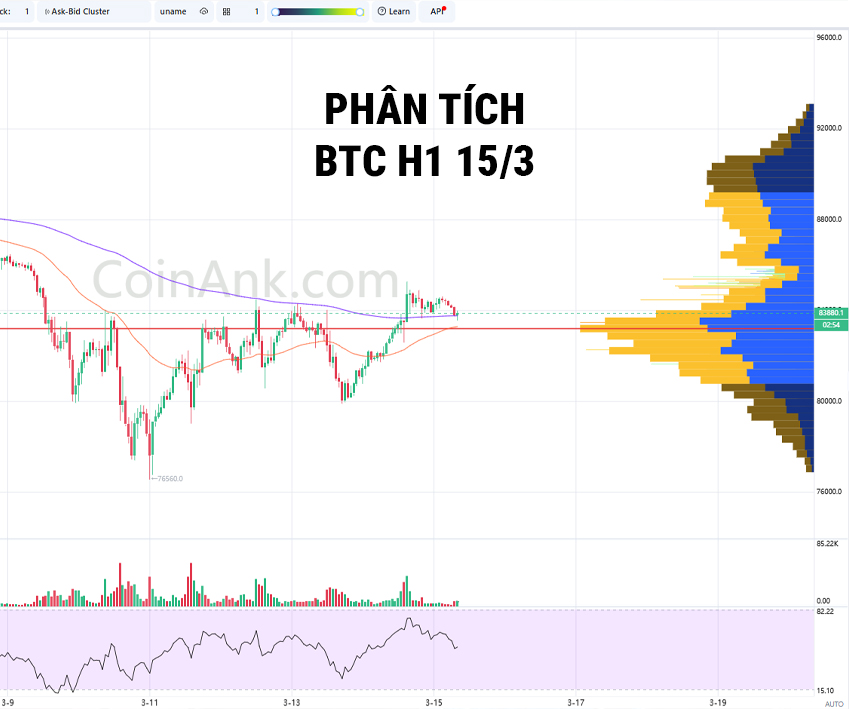
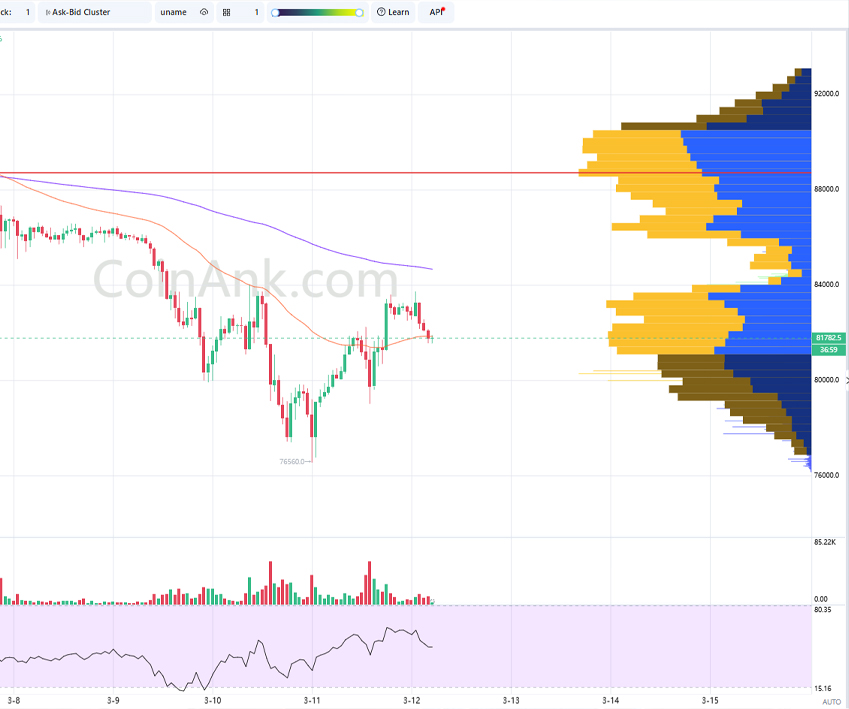
Bitcoin (BTC) continues its correction after a strong rally, with the downtrend prevailing on the 1D timeframe. It is essential to monitor the reaction at the $78,000 – $80,000 support zone to determine the appropriate strategy.
1️⃣ Trend & Market Structure (SMC)
- Main Trend: Corrective downtrend following a strong upward move.
- Break of Structure (BoS): Short-term bullish structure broken, indicating potential downtrend formation.
- Supply Zone (Resistance): $90,000 – $92,000.
- Demand Zone (Support): $78,000 – $80,000.
2️⃣ Volume Profile (VPVR)
- POC (Point of Control): ~$60,489 (Price is still above the POC, not confirming a long-term downtrend).
- High Volume Node (HVN): $90,000 – $100,000 (High liquidity distribution zone).
- Low Volume Node (LVN): Below $70,000 (If price drops to this level, further decline is possible).
3️⃣ EMA (Exponential Moving Average)
- EMA200: ~$85,515 – Price is below EMA200, signaling a dominant long-term downtrend.
- EMA50: ~$90,225 – Price also remains below EMA50, confirming weak momentum.
🔹 The downtrend remains dominant on the 1D timeframe.
4️⃣ RSI & Momentum Indicators
- RSI ~42: In the neutral zone but trending downwards.
- RSI is not yet oversold, meaning further downside is possible without strong buying pressure.
🎯 Trading Strategy
📉 Short Scenario (Following the Main Trend)
Entry: $85,000 – $86,000 (if price retraces upward but fails to break resistance).
Stop Loss: $87,000.
Take Profit:
- TP1: $82,000.
- TP2: $80,000.
- TP3: $78,000.
Condition: Price retests EMA200 but fails to break out. Selling volume remains dominant.
📈 Long Scenario (If Reversal Signals Appear)
Entry: $78,000 – $80,000 (if strong buying reaction occurs at the demand zone).
Stop Loss: $76,500.
Take Profit:
- TP1: $82,000.
- TP2: $85,000.
- TP3: $88,000.
Condition: RSI shows bullish divergence, strong reversal candles appear, and buying volume increases significantly at support.
5️⃣ Conclusion & Next Steps
📊 Trend: Corrective downtrend within a long-term bullish context.
📉 Volume: Decreasing with no signs of strong buying pressure.
🔄 Reversal Signs: RSI not yet oversold, further monitoring required.
📍 Key Levels to Watch:
- Critical Resistance: $85,000 – $86,000.
- Key Support: $78,000 – $80,000.
🚀 Strategy:
- Short if price retests EMA200 and faces rejection.
- Long if strong reversal signals occur at $78,000 – $80,000.
⚠️ Keep an eye on EMA50, EMA200, and Volume for confirmation! 🚀
* Sign up for Binance to trade: Here
* Telegram: 3aW Crypto


