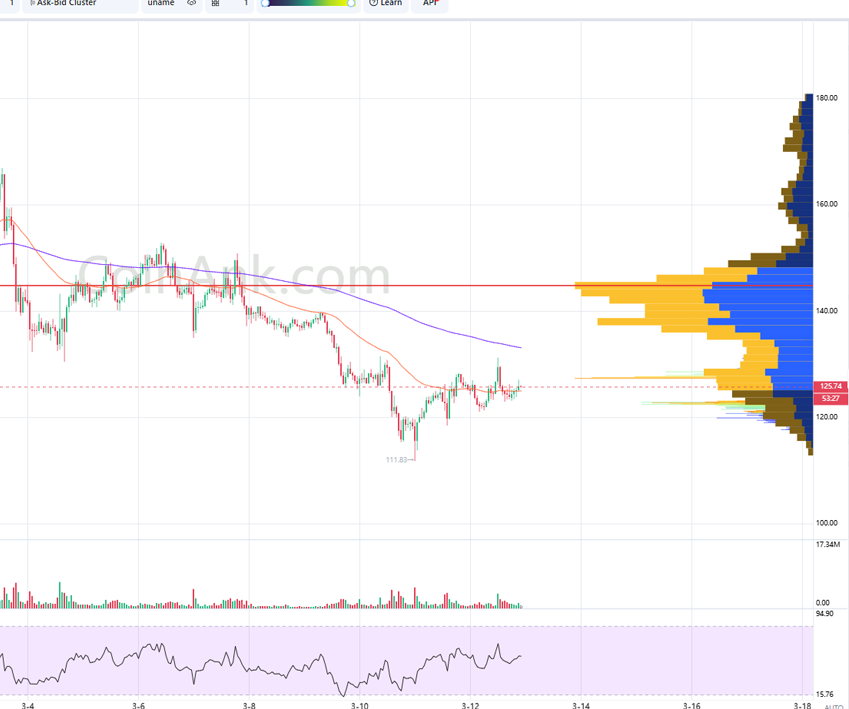
SOL/USDT Analysis – 1H Timeframe (March 13)
1️⃣ Trend & Market Structure (SMC)
- Main Trend: Bearish, price remains below EMA200.
- Break of Structure (BoS): Price is forming higher lows, showing signs of accumulation.
- Supply Zone (Resistance): $140 – $145 (POC + EMA200).
- Demand Zone (Support): $110 – $120 (High liquidity area).
2️⃣ Volume Profile (VPVR)
- POC (Point of Control): ~$144.84 (Key resistance).
- High Volume Node (HVN): $140 – $150 (Area with significant sell orders).
- Low Volume Node (LVN): ~$110 (Losing this level could trigger a deeper drop).
3️⃣ EMA (Exponential Moving Averages)
- EMA200 (Purple): ~$133 – Price is still below, no breakout signal yet.
- EMA50 (Red): ~$125 – Price is approaching, could retest.
- 🔹 Needs to break EMA50 and hold above $130 to sustain further upside.
- 🔹 If rejected at EMA50, price could return to the support zone.
4️⃣ RSI (Relative Strength Index)
RSI (14): ~53.80, slightly above neutral, showing signs of mild recovery.
If it surpasses 60, a stronger bullish momentum could be confirmed.
🎯 Trading Strategy
📉 Short Scenario (If Price is Rejected at Resistance)
Entry: $130 – $135 (EMA200 resistance).
Stop Loss: $140.
Take Profit:
- TP1: $120.
- TP2: $115.
- TP3: $110.
Condition: RSI stays below 60 + price rejection at EMA200.
📈 Long Scenario (If Price Holds Support and Breaks EMA200)
Entry: $120 – $125 (VPVR support + EMA50).
Stop Loss: $118.
Take Profit:
- TP1: $130.
- TP2: $140.
- TP3: $150.
Condition: Price holds above EMA50 + RSI stays above 50.
5️⃣ Conclusion
- Main Trend: Bearish but showing signs of accumulation.
- Key Resistance: $130 – $135 (EMA200 + POC).
- Strong Support: $110 – $120 (Volume Profile support zone).
- Main Strategy: Wait for breakout confirmation or short in line with the trend.
⚠️ Be patient, avoid FOMO without clear signals! 🚀
* Sign up for Binance to trade: Here
* Telegram: 3aW Crypto