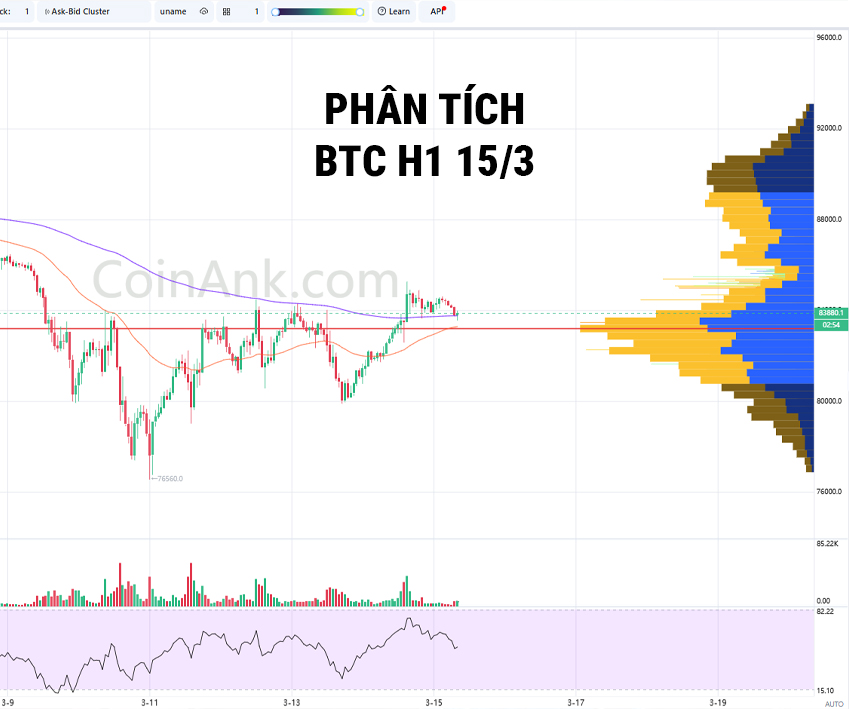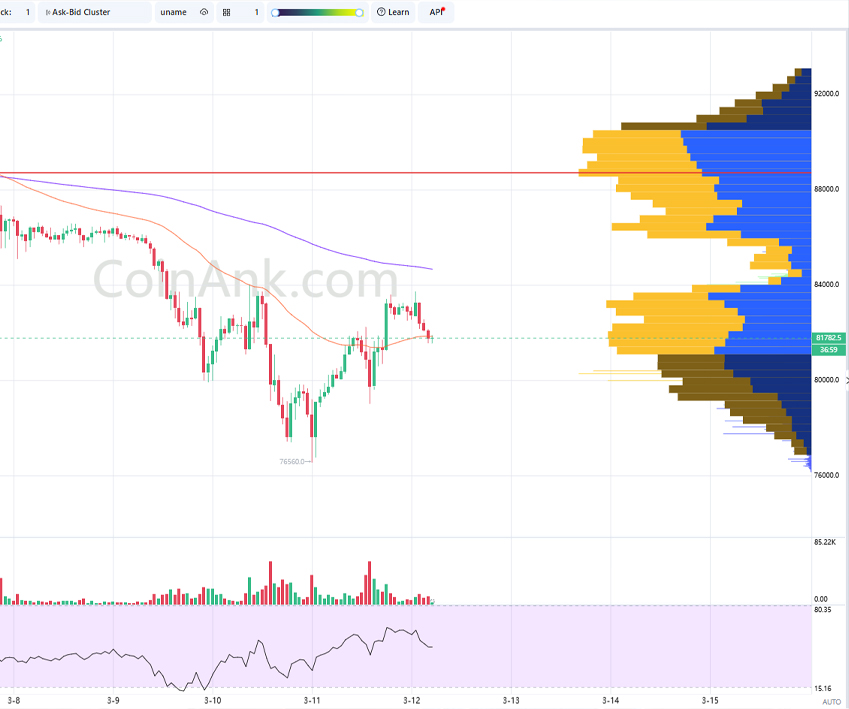
BTC/USDT Update – 1H Timeframe (March 12)
1️⃣ Trend & Market BTC Structure (SMC)
- Main Trend: Downtrend, but showing signs of recovery.
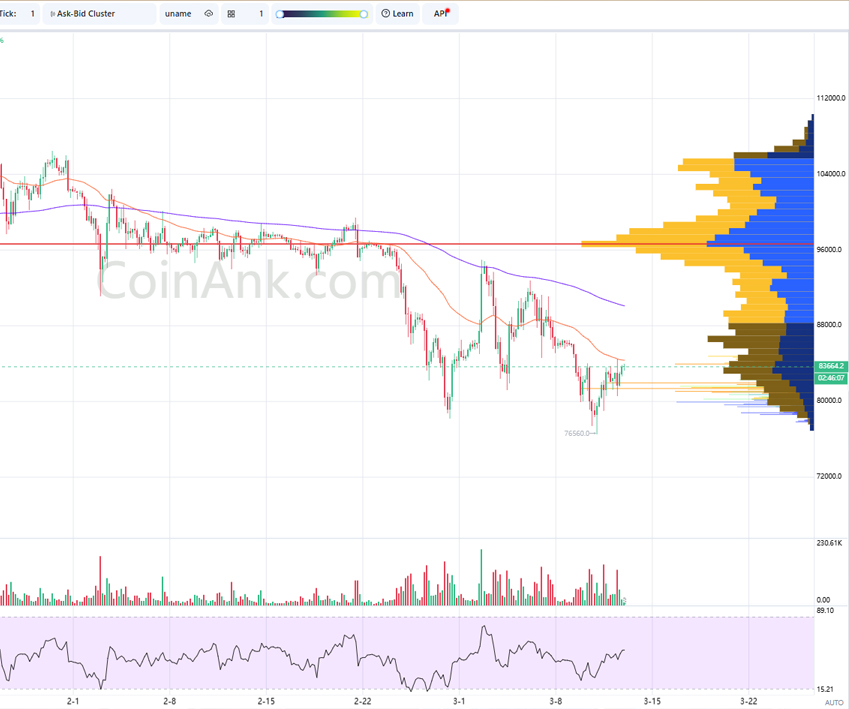
- Break of Structure (BoS): Higher Low (HL) formed around $76,560.
- Supply Zone (Resistance): $84,000 – $85,000 (POC zone + EMA200).
- Demand Zone (Support): $76,500 – $80,000 (high liquidity area).
2️⃣ Volume Profile (VPVR)
- POC (Point of Control): ~$82,734 (strong resistance).
- High Volume Node (HVN): $84,000 – $88,000 (breaking this zone could trigger a strong rally).
- Low Volume Node (LVN): ~$76,500 (losing this level could lead to a deeper drop).
3️⃣ EMA (Exponential Moving Averages)
- EMA200 (Purple): ~$84,673 – Price is still below EMA200, indicating no clear trend reversal yet.
- EMA50 (Red): ~$81,835 – Price is currently testing EMA50.
- 🔹 If price holds above EMA50, it may continue recovering toward EMA200.
- 🔹 If rejected, it may retest the support zone.
4️⃣ RSI (Relative Strength Index)
- RSI (14): ~49.69, neutral, no overbought or oversold signals.
- Needs to break above 55-60 to confirm stronger bullish momentum.
🎯 Trading Strategy
📉 Short Scenario (Following the Main Trend)
Entry: $82,500 – $83,500 (POC resistance + EMA200).
Stop Loss: $84,200.
Take Profit:
- TP1: $81,000.
- TP2: $79,000.
- TP3: $76,500.
Condition: Price rejection at POC + RSI stays below 55.
📈 Long Scenario (If Price Holds Support)
Entry: $79,000 – $80,000 (VPVR support zone).
Stop Loss: $78,500.
Take Profit:
- TP1: $82,000.
- TP2: $83,500.
- TP3: $85,000.
Condition: Price holds above EMA50 + RSI breaks above 55.
5️⃣ Conclusion
- Main Trend: Downtrend, but signs of recovery.
- Key Resistance: $82,500 – $84,000.
- Strong Support: $76,500 – $80,000.
- Main Strategy: Wait for reaction at POC to decide on Long/Short.
⚠️ Strict risk management, avoid FOMO! 🚀
* Sign up for Binance to trade: Here
* Telegram: 3aW Crypto


