Solana (SOL) Price Analysis – 4H Chart on March 16
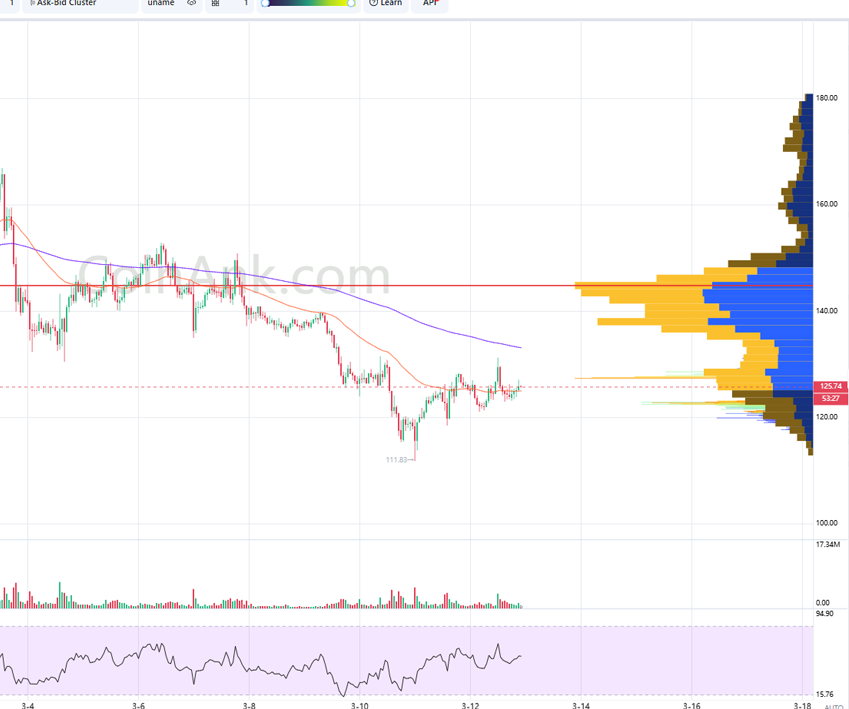
On March 16, Solana (SOL) is showing slight signs of recovery within its downtrend. The detailed analysis below will help you identify key resistance and support zones to optimize your trading strategy.
1️⃣ Trend & Market Structure (SMC)
Main Trend: Downtrend with signs of recovery.
Break of Structure (BoS): The price remains below key resistance levels.
Supply Zone (Strong Resistance): $140 – $150.
Demand Zone (Key Support): $110 – $120.
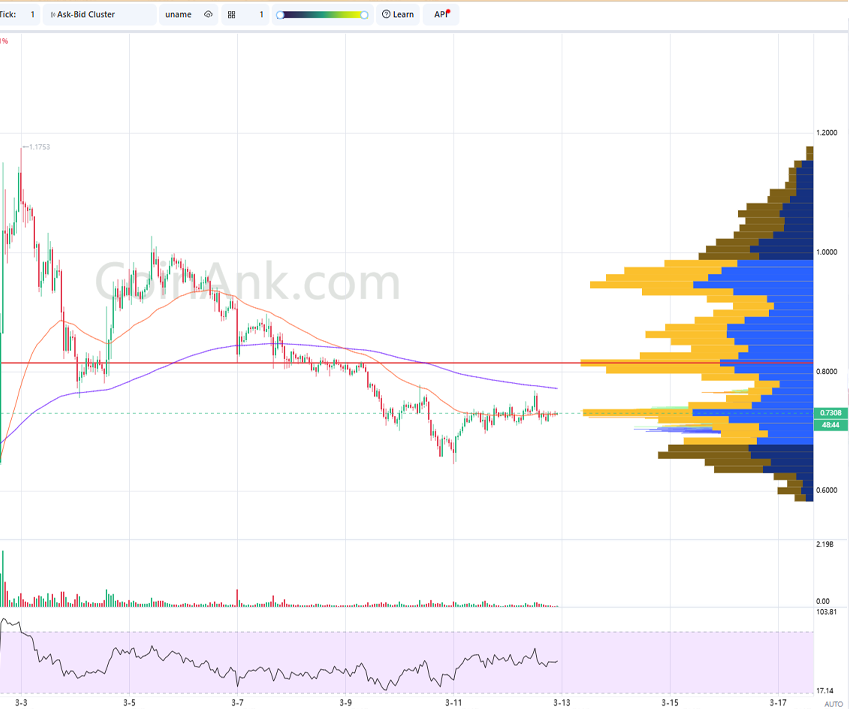
2️⃣ Volume Profile (VPVR)
POC (Point of Control): ~$145 (Highest trading volume).
High Volume Node (HVN): $140 – $150 (Strong resistance).
Low Volume Node (LVN): Below $110 (If breakdown occurs, further decline is likely).
3️⃣ EMA (Exponential Moving Average)
EMA200: ~$160 – Key resistance.
EMA50: ~$135 – A breakout is needed for further upside.
🔹 If the price holds above EMA50, it may test the $140 – $150 zone.
🔹 If it fails to break above EMA50, the price might revisit the $120 support zone.
4️⃣ RSI (Relative Strength Index)
RSI is recovering from the oversold region (~30).
It needs to surpass 50 to confirm strong buying pressure.
🎯 TRADING STRATEGY
📉 Short Scenario (Preferred if rejected at $140 – $150)
Entry: $140 – $145.
Stop Loss: $150.
Take Profit:
- TP1: $130.
- TP2: $120.
- TP3: $110.
Condition: Price reaches the supply zone and shows a bearish reaction. EMA50 remains unbroken. RSI weakens and selling volume increases.
📈 Long Scenario (If EMA50 + POC $145 Breakout)
Entry: $135 – $140.
Stop Loss: $130.
Take Profit:
- TP1: $150.
- TP2: $160.
- TP3: $175.
Condition: Price remains above EMA50 and closes above $140. Buying volume increases significantly on breakout. RSI stays above 55.
5️⃣ Conclusion
📊 Trend: Downtrend still dominates, a breakout above $145 – $150 is needed to confirm a reversal.
📉
* Sign up for Binance to trade: Here
* Telegram: 3aW Crypto


