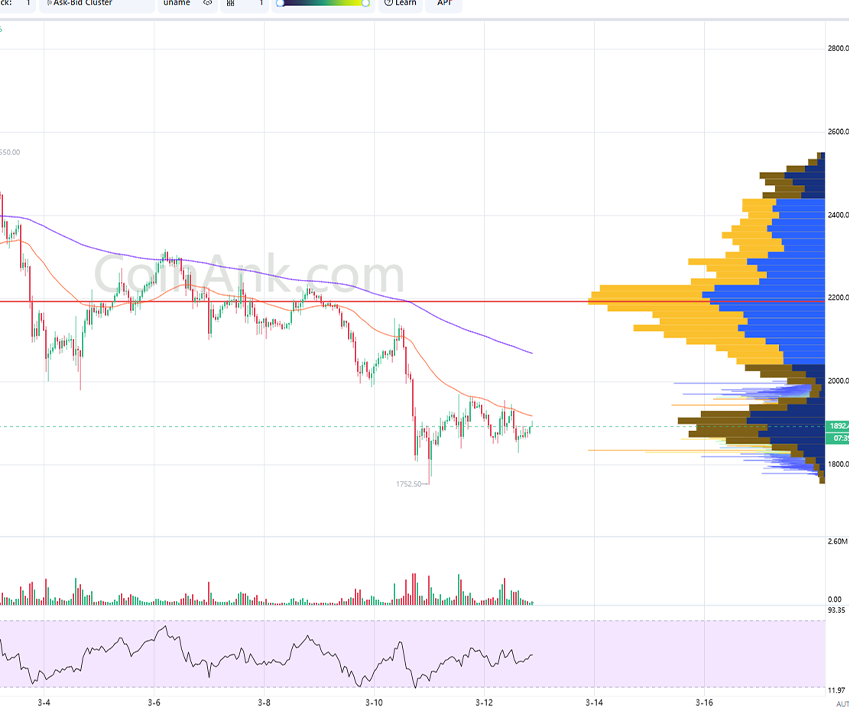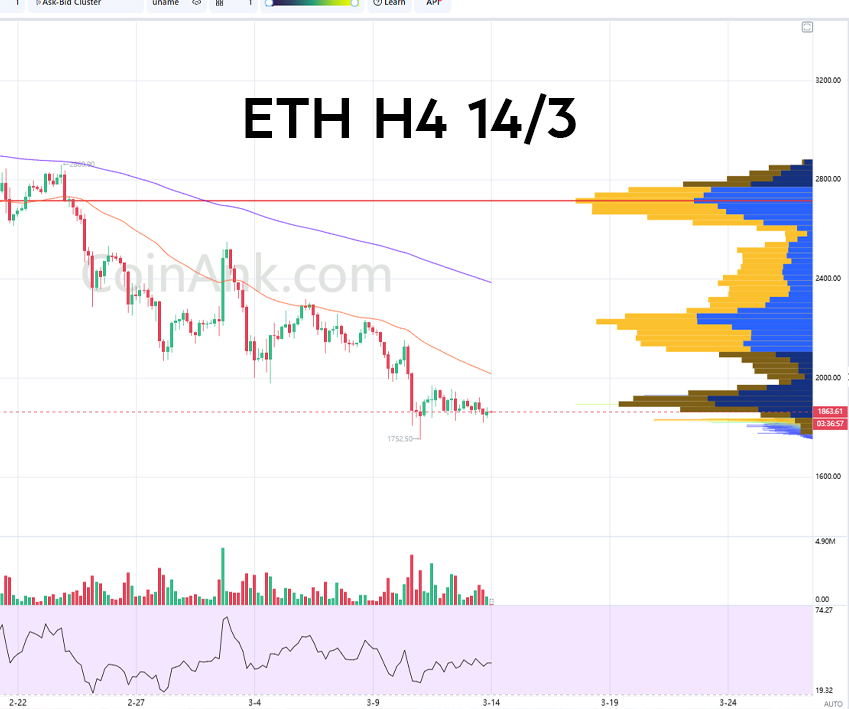
ETH/USDT Analysis – 4H Timeframe (March 14)
1️⃣ ETH Trends & Market Structure (SMC)
- Main Trend: Strong Downtrend, price is below EMA50 and EMA200.
- Break of Structure (BoS): Price continues to form lower lows, confirming the downtrend.
- Supply Zone (Resistance): $2,400 – $2,800 (High liquidity zone + VPVR).
- Demand Zone (Support): $1,750 – $1,800 (Recent bottom zone + Support volume).
2️⃣ Volume Profile (VPVR)
- POC (Point of Control): ~$2,175 (Key resistance).
- High Volume Node (HVN): $2,000 – $2,400 (Strong selling pressure).
- Low Volume Node (LVN): ~$1,750 (If breached, the price may decline further).
3️⃣ EMA (Exponential Moving Average)
- EMA200: ~$2,932 – Price is far below EMA200, indicating a strong downtrend.
- EMA50: ~$2,704 – Still acting as a major dynamic resistance.
🔹 The price needs to break above EMA50 to signal a recovery.
🔹 If rejected at EMA50, the downtrend may continue.
4️⃣ RSI (Relative Strength Index)
- RSI (14): ~34.23 – Near the oversold zone but no strong recovery signals yet.

🎯 Trading Strategy
📉 Short Scenario (Following the main trend)
Entry: $1,850 – $1,900 (Minor pullback before further decline).
Stop Loss: $1,950.
Take Profit:
- TP1: $1,800.
- TP2: $1,750.
- TP3: $1,650.
Condition: Price rejection at $1,850 – $1,900 zone, RSI remains below 40.
📈 Long Scenario (If reversal signals appear)
Entry: $1,750 – $1,800 (Strong support from VPVR).
Stop Loss: $1,700.
Take Profit:
- TP1: $1,850.
- TP2: $1,900.
- TP3: $2,000.
Condition: RSI rises above 40 + price holds above $1,750.
5️⃣ ETH Trend Conclusion
Main Trend: Strong downtrend, no clear recovery signals yet.
Key Resistance: $1,850 – $1,900 (EMA50 + VPVR).
Strong Support: $1,750 – $1,800 (Low liquidity zone + previous bottom).
Primary Strategy: Short following the trend, Long only if strong reversal signals occur.
⚠️ Wait for confirmation of price reaction at $1,750 before entering any trades! 🚀
* Sign up for Binance to trade: Here
* Telegram: 3aW Crypto


