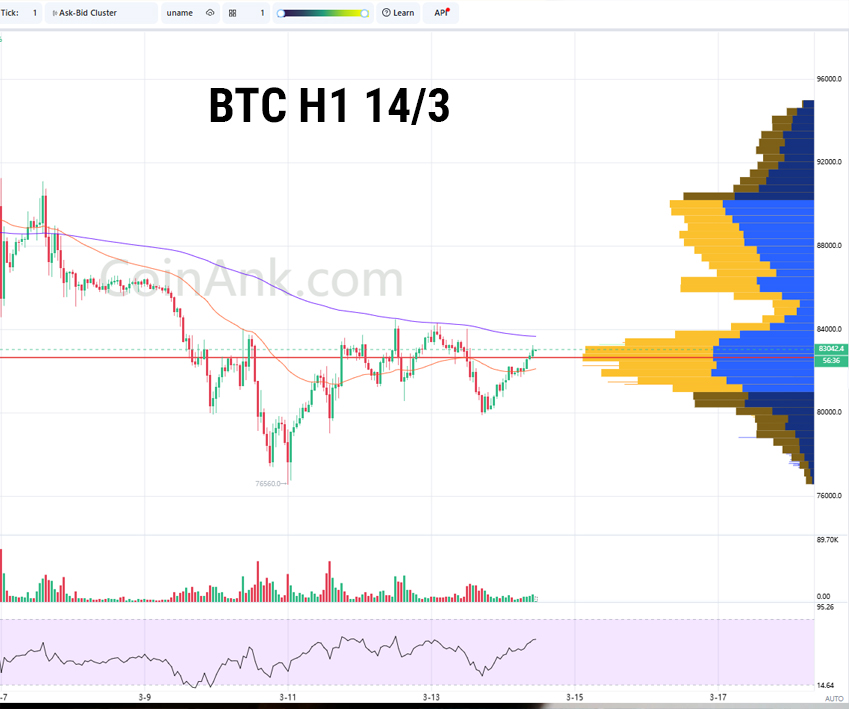
BTC/USDT Analysis – 1H Chart on March 14
Currently, BTC/USDT is in a downtrend but showing slight signs of recovery. Careful analysis will help us build a reasonable trading strategy.
1️⃣ Trend & Market Structure (SMC)
Main Trend: Downtrend, but attempting a recovery
Break of Structure (BoS): Price hasn’t broken through the critical resistance at $84,000
Supply Zone (Resistance): $83,500 – $84,500 (EMA200 + VPVR)
Demand Zone (Support): $76,500 – $78,000 (Recent Low)
2️⃣ Volume Profile (VPVR)
POC (Point of Control): ~$82,660 (Price is currently testing this area)
High Volume Node (HVN): $80,500 – $83,500 (Strong accumulation zone)
Low Volume Node (LVN): ~$76,500 (If rejected at POC, the price may retest this zone)
3️⃣ EMA (Exponential Moving Average)
EMA200 (Purple): ~$83,675 – Significant dynamic resistance
EMA50 (Red): ~$82,127 – Price has broken out of EMA50 but has not confirmed a reversal
🔹 If the price holds above EMA50 and POC, a continued rebound is possible.
🔹 If rejected at EMA200, the downtrend is likely to resume.
4️⃣ RSI (Relative Strength Index)
- RSI (14): ~81.81 – Overbought, potential selling pressure
🎯 Trading Strategy
📉 Short Scenario (Following the Main Trend)
Entry: $83,500 – $84,500 (Resistance + EMA200)
Stop Loss: $85,000
Take Profit:
- TP1: $82,000
- TP2: $80,500
- TP3: $78,000
Condition: RSI overbought + Price fails to break EMA200
📈 Long Scenario (High Risk, Requires Confirmation)
Entry: $82,500 – $83,000 (Holding above POC)
Stop Loss: $81,500
Take Profit:
- TP1: $84,000
- TP2: $85,500
- TP3: $87,000
Condition: Price closes above $84,000 with high volume
5️⃣ Conclusion
Main Trend: Downtrend, with the price testing a key resistance zone
Major Resistance: $83,500 – $84,500 (EMA200 + VPVR)
Key Support: $76,500 – $78,000
Primary Strategy: Short if rejected at EMA200, Long if a clear breakout occurs
⚠️ Wait for confirmation of price reaction at EMA200 before entering trades! 🚀
* Sign up for Binance to trade: Here
* Telegram: 3aW Crypto


