Bitcoin Analysis on March 20: Signs of a Bullish Reversal
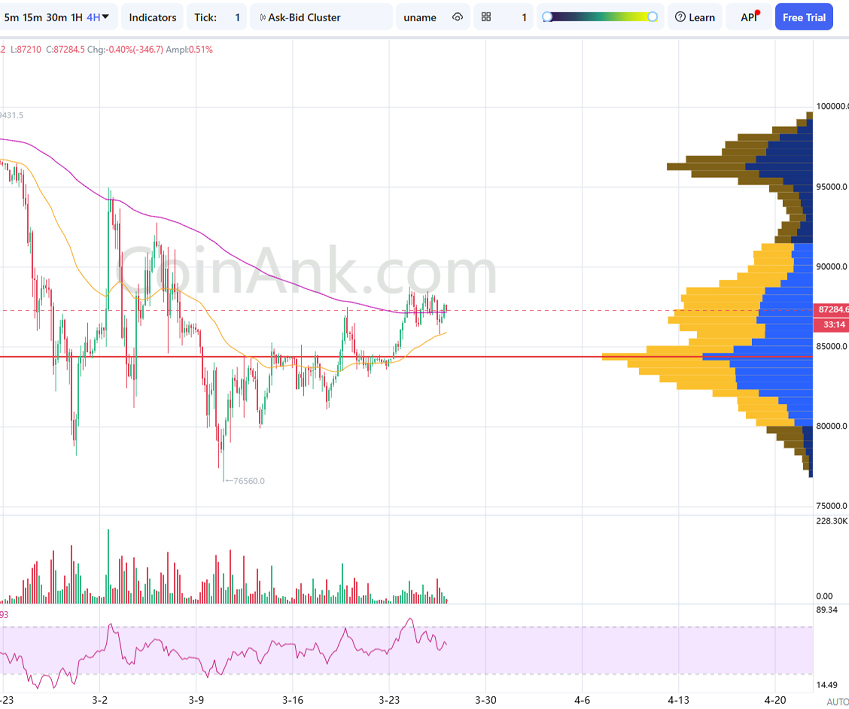
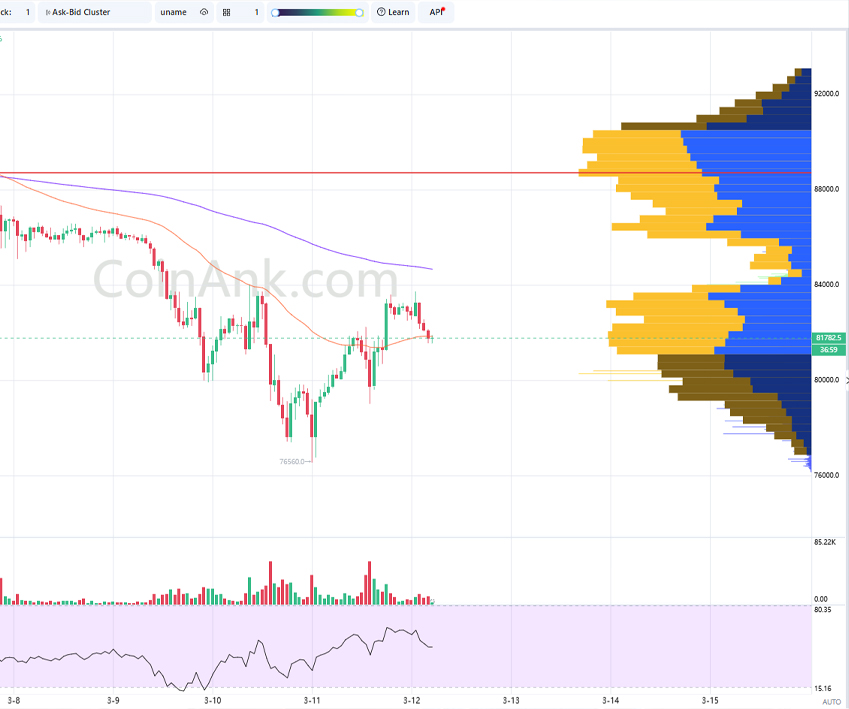
Bitcoin (BTC) is in a short-term bullish trend after breaking out above the EMA200 on the 2H chart. If the price holds above $85,000, it could continue to the resistance zone of $87,500 – $89,000.
1️⃣ Trend & Market Structure (SMC)
- Main Trend: Overall bearish, but the price shows signs of recovery.
- Break of Structure (BoS): The price has broken through the nearest resistance at ~$85,000.
- Demand Zone (Key Support): $83,000 – $84,000.
- Supply Zone (Next Resistance): $87,500 – $89,000.
2️⃣ Volume Profile (VPVR)
- POC (Point of Control): ~$83,202 (Strong support, previously tested multiple times).
- High Volume Node (HVN): $83,000 – $85,000 (Area with strong buying activity).
- Low Volume Node (LVN): $88,000 – $90,000 (Price may move quickly if it surpasses this zone).
3️⃣ EMA (Exponential Moving Average)
- EMA200: ~$84,963 – The price has recently broken above EMA200, indicating a bullish signal.
- EMA50: ~$83,713 – Important dynamic support; maintaining above this level may continue the uptrend.
🔹 If the price remains above EMA200, the uptrend could proceed towards $87,500 – $89,000.
🔹 If the price fails to hold EMA50, it may retest the POC at $83,200.
4️⃣ RSI & Momentum Signals
- RSI ~63: Not yet in the overbought zone, still room for further growth.
- Key Watch: If RSI exceeds 70, a slight pullback may occur before a continuation upward.
5️⃣ Chart Patterns
- After breaking EMA200, the price may form a Bullish Continuation pattern if it holds above $85,000.
- If the price is strongly rejected at $87,500 – $89,000, a Double Top pattern may emerge.
🎯 Trading Strategies
📉 Short Scenario (If the price faces strong rejection at $87,500 – $89,000)
Entry: $87,500 – $89,000 (Strong resistance near the LVN).
Stop Loss: $89,500.
Take Profit:
- TP1: $85,500.
- TP2: $84,000 (EMA200).
- TP3: $83,200 (POC).
Conditions: RSI above 70 (overbought). Strong rejection with decreasing volume.
📈 Long Scenario (Preferred if the price retests EMA200 and bounces back)
Entry: $84,800 – $85,200 (Retest EMA200).
Stop Loss: $83,500.
Take Profit:
- TP1: $86,500.
- TP2: $87,500.
- TP3: $89,000.
Conditions: Mild pullback while maintaining above EMA200. RSI remains in the 50-55 range. Buying volume increases after the pullback.
6️⃣ Conclusion & Next Steps
📊 Trend: Short-term bullish following the EMA200 breakout.
📉 Volume: Increasing volume supports the breakout.
🔄 Reversal Signals: None currently, but resistance around $87,500 – $89,000 may trigger selling pressure.
📍 Key Levels to Watch:
- Support Levels: $83,200 (POC) and $84,963 (EMA200).
- Resistance Levels: $87,500 – $89,000.
* Sign up for Binance to trade: Here
* Telegram: 3aW Crypto


