Guide to Using EMA 34, 89, 200 in Trading
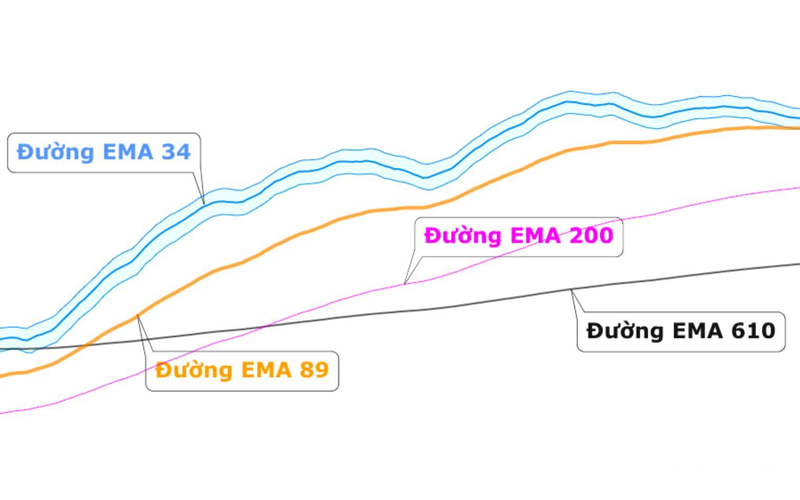
The Exponential Moving Average (EMA) is a popular tool in technical analysis, helping traders identify trends and determine entry points. Among them, the EMA 34, EMA 89, and EMA 200 are commonly used to assess short-term, medium-term, and long-term trends.
1. Overview of EMA
EMA is a type of Moving Average (MA), but unlike the Simple Moving Average (SMA), EMA places more weight on recent price data, allowing it to respond more quickly to market changes.
EMA Formula:

With Smoothing Factor = 2/(N+1), where N is the EMA period.
2. Significance of EMA 34, 89, 200
- EMA 34: Determines short-term trends, often used in scalping or day trading.
- EMA 89: Identifies medium-term trends, supporting swing trading strategies.
- EMA 200: Evaluates long-term trends, determining whether the market is in a bullish or bearish phase.
3. How to Set Up EMA on TradingView
- Open the TradingView platform (or other trading software like MT4, MT5).
- Go to Indicators → Search for Exponential Moving Average (EMA).
- Add three EMAs with the values 34, 89, 200.
- Customize the colors for better visualization (e.g., EMA 34 – Green, EMA 89 – Yellow, EMA 200 – Red).
4. Trading Strategies with EMA 34, 89, 200
4.1. Identifying Trends
- When EMA 34 crosses above EMA 89 → Short-term uptrend.
- When EMA 34 crosses below EMA 89 → Short-term downtrend.
- When the price is above EMA 200 → Long-term uptrend.
- When the price is below EMA 200 → Long-term downtrend.
4.2. Entry Strategies
✅ Buy Strategy:
- EMA 34 crosses above EMA 89.
- Price bounces off EMA 200.
- Volume increases, with confirmation from RSI or MACD.
❌ Sell Strategy:
- EMA 34 crosses below EMA 89.
- Price is rejected at EMA 200.
- Reversal candlestick patterns such as Engulfing, Doji, Shooting Star appear.
4.3. Exit Strategies
- Set a stop loss below EMA 89 or EMA 200 to manage risk.
- Consider exiting buy positions when EMA 34 crosses below EMA 89.
- Take partial profits at key support/resistance levels.
5. Real-World Examples
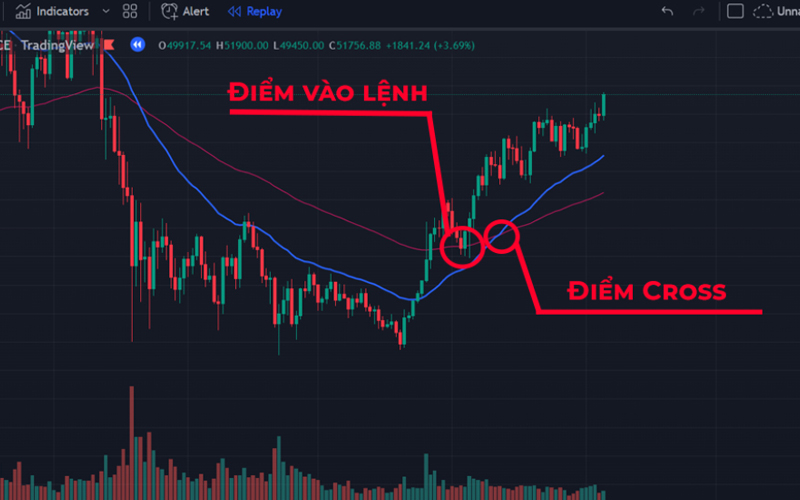
Example 1: Trading in an Uptrend
- Price is above EMA 200 → Long-term uptrend.
- EMA 34 crosses above EMA 89 → Short-term uptrend confirmed.
- Traders may enter a BUY trade on the EMA 89 retest, placing a stop loss below EMA 200.
Example 2: Trading in a Downtrend
- Price is below EMA 200 → Long-term downtrend.
- EMA 34 crosses below EMA 89 → Short-term downtrend confirmed.
- Traders may enter a SELL trade when the price retests EMA 89.
6. Conclusion
- EMA 34, 89, 200 helps identify trends across different time frames.
- Combine EMA with other indicators (RSI, MACD) for better trade decisions.
- Apply proper risk management using stop loss orders.
- Avoid trading in sideways markets as EMA is less effective without a trend.
👉 To practice, open TradingView, add the EMA lines, and experiment with real charts! 🚀
* Sign up for Binance to trade: Here
* Telegram: 3aW Crypto


