What is Elliott? Combining Elliott and Fibonacci in Trading
In technical analysis, the Elliott Wave Theory and the Fibonacci tool are powerful instruments that help traders identify trends and find optimal entry points. This article will explain the Elliott concept and how to combine it with Fibonacci for more effective trading.

1. What is Elliott Wave Theory?
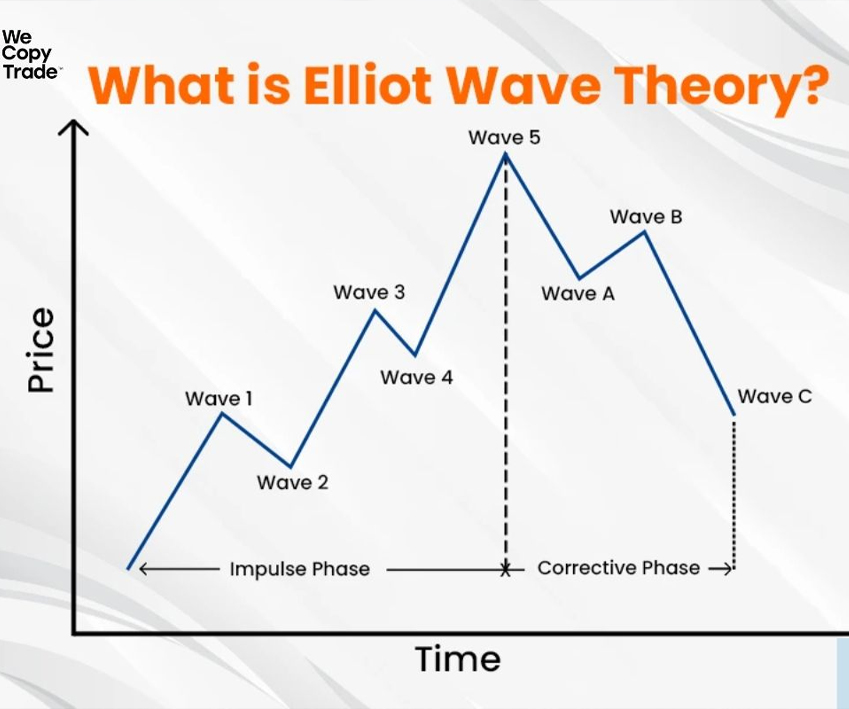
The Elliott Wave Theory was developed by Ralph Nelson Elliott in the 1930s. He observed that the market moves in repetitive patterns, consisting of cycles of rises and falls driven by crowd psychology.
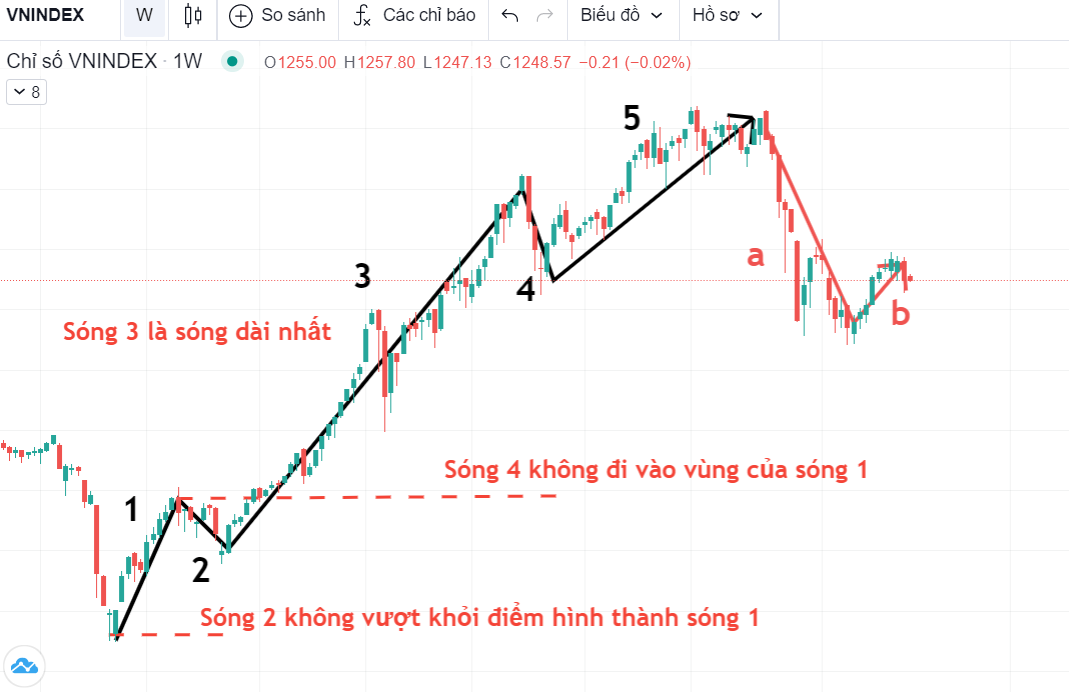
The structure of Elliott waves includes:
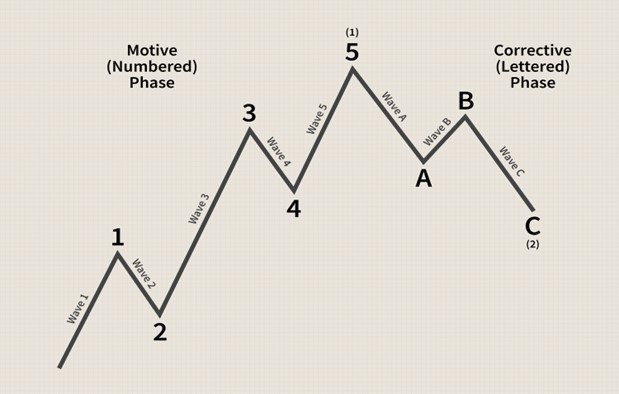
- Impulse Wave: Consists of 5 waves that move in the direction of the primary trend (1-2-3-4-5).
- Corrective Wave: Consists of 3 waves that move against the primary trend (A-B-C).

2. What is Fibonacci?
The Fibonacci sequence is a series of mathematical numbers where each number is the sum of the two preceding ones. In trading, Fibonacci levels are used to identify potential support and resistance levels.
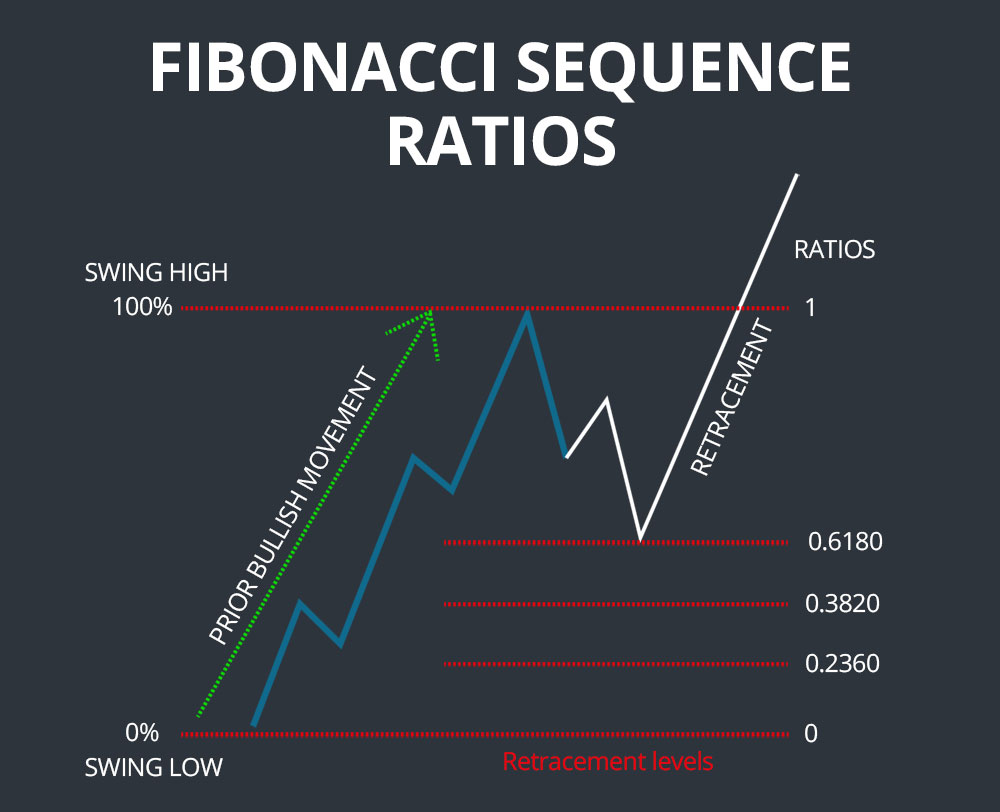
Common Fibonacci levels:
- 0.382 (38.2%)
- 0.5 (50%)
- 0.618 (61.8%)
- 0.786 (78.6%)
3. How to Combine Elliott and Fibonacci in Trading
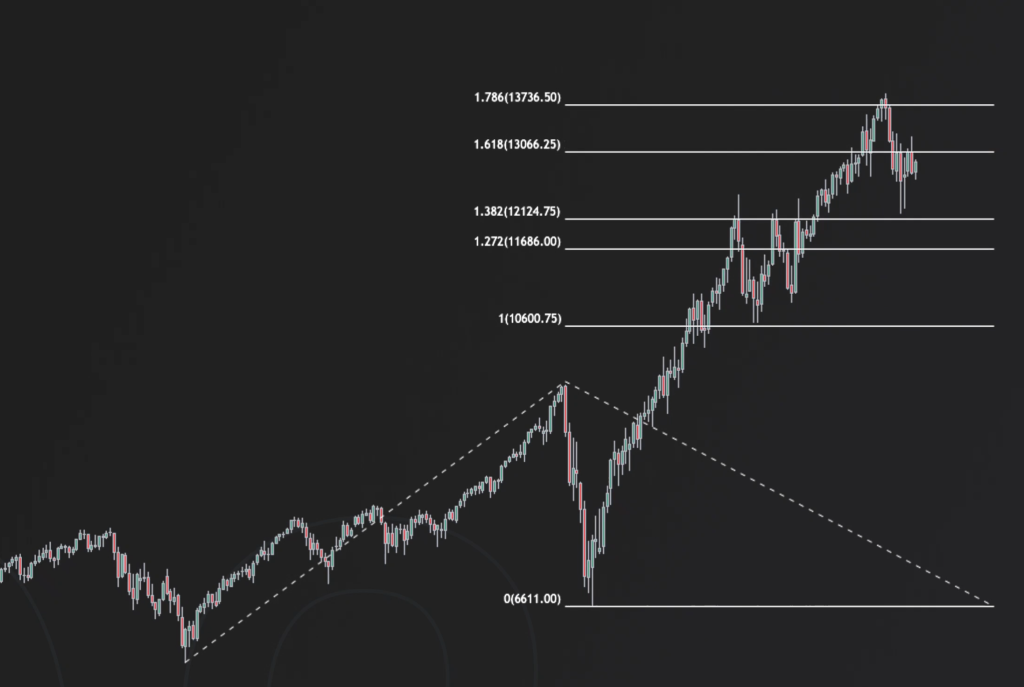
- Identify Elliott Waves: Look for 1-2-3-4-5 wave structures in the primary trend.
- Use Fibonacci Retracement: Measure from the bottom of wave 1 to the top of wave 3 to find retracement levels for wave 4.
- Use Fibonacci Extension: Measure from wave 1-2 to project the target for wave 5.
Example: If wave 3 is complete, apply Fibonacci Retracement to identify the correction level of wave 4 at 0.618 or 0.786.
4. Illustrative Example
5. Conclusion
Combining the Elliott Wave Theory and Fibonacci helps traders identify major trends and optimize their entry points. However, to succeed, you need consistent practice and effective risk management.
* Sign up for Binance to trade: Here
* Telegram: 3aW Crypto


