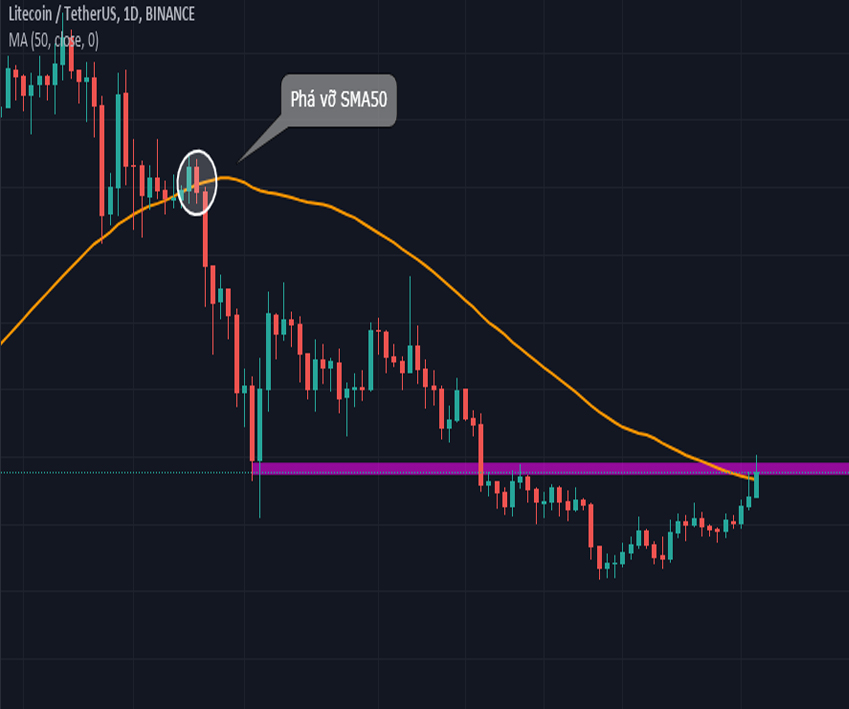
Indicators to Use in Technical Analysis
Technical analysis is a method of using historical price and trading volume data to predict future price trends. Below are some basic technical indicators commonly used by investors:
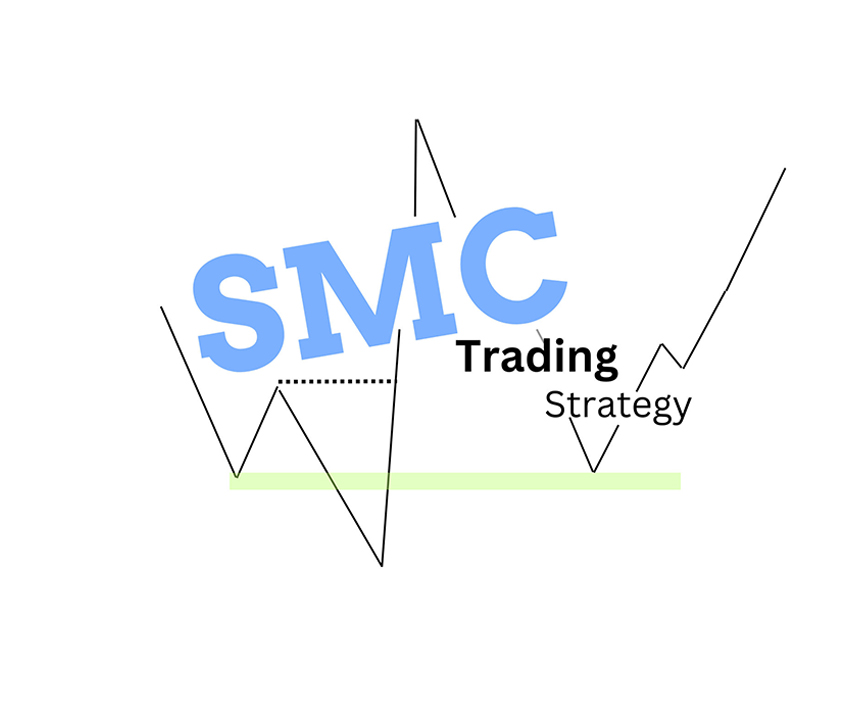
1. Support and Resistance
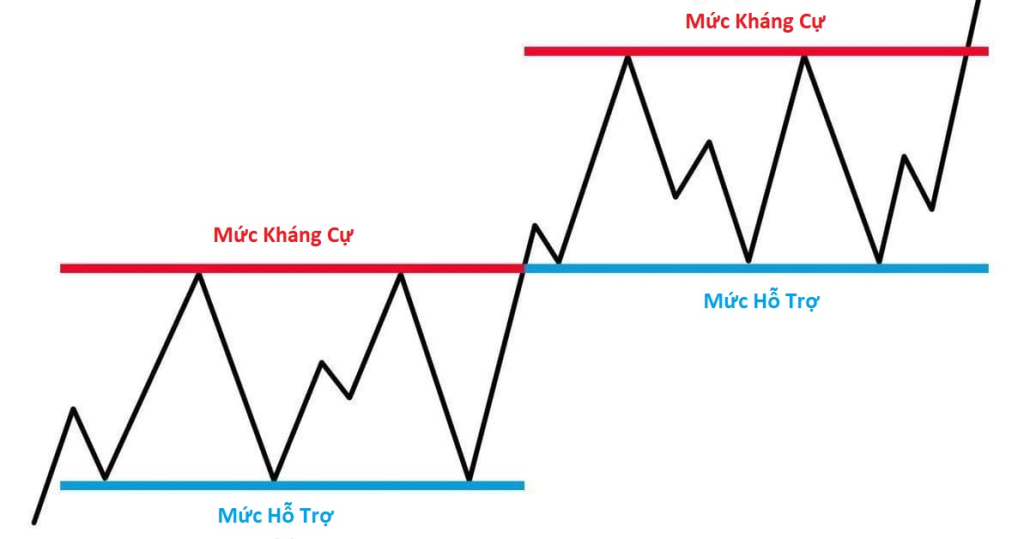
- Support: A price level where a downtrend is expected to reverse due to increased buying pressure.
- Resistance: A price level where an uptrend is expected to reverse due to increased selling pressure.
For example, in an uptrend, when the price retraces and bounces back up, the lowest price before the uptrend resumes is considered a support level. Conversely, in a downtrend, support and resistance levels are formed as prices fluctuate over time.
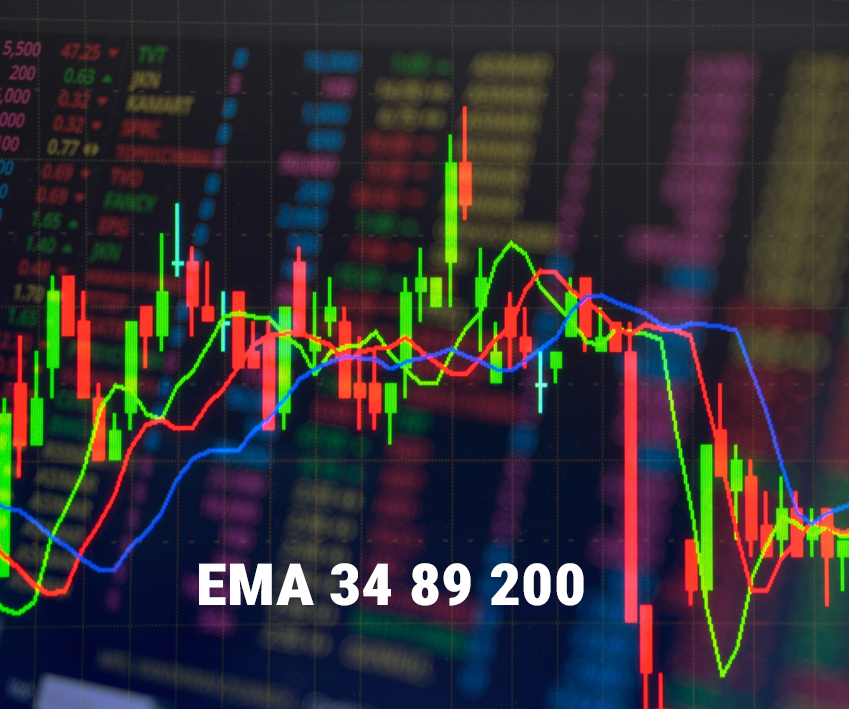
2. Simple Moving Average (SMA)
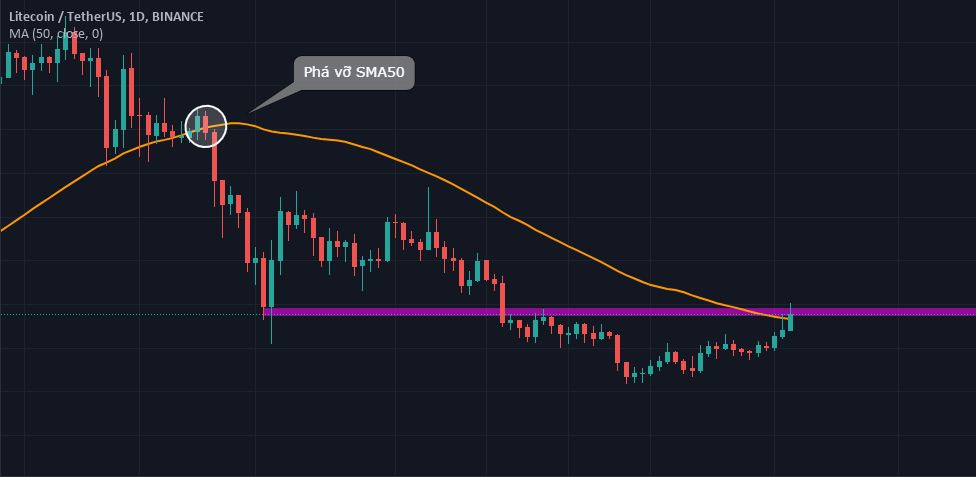
The SMA is calculated by summing the closing prices over a specific period and dividing by the number of periods. For example, a 20-day SMA is the average of the closing prices over the past 20 days. SMA helps in identifying the long-term trend of a stock.
3. Bollinger Bands
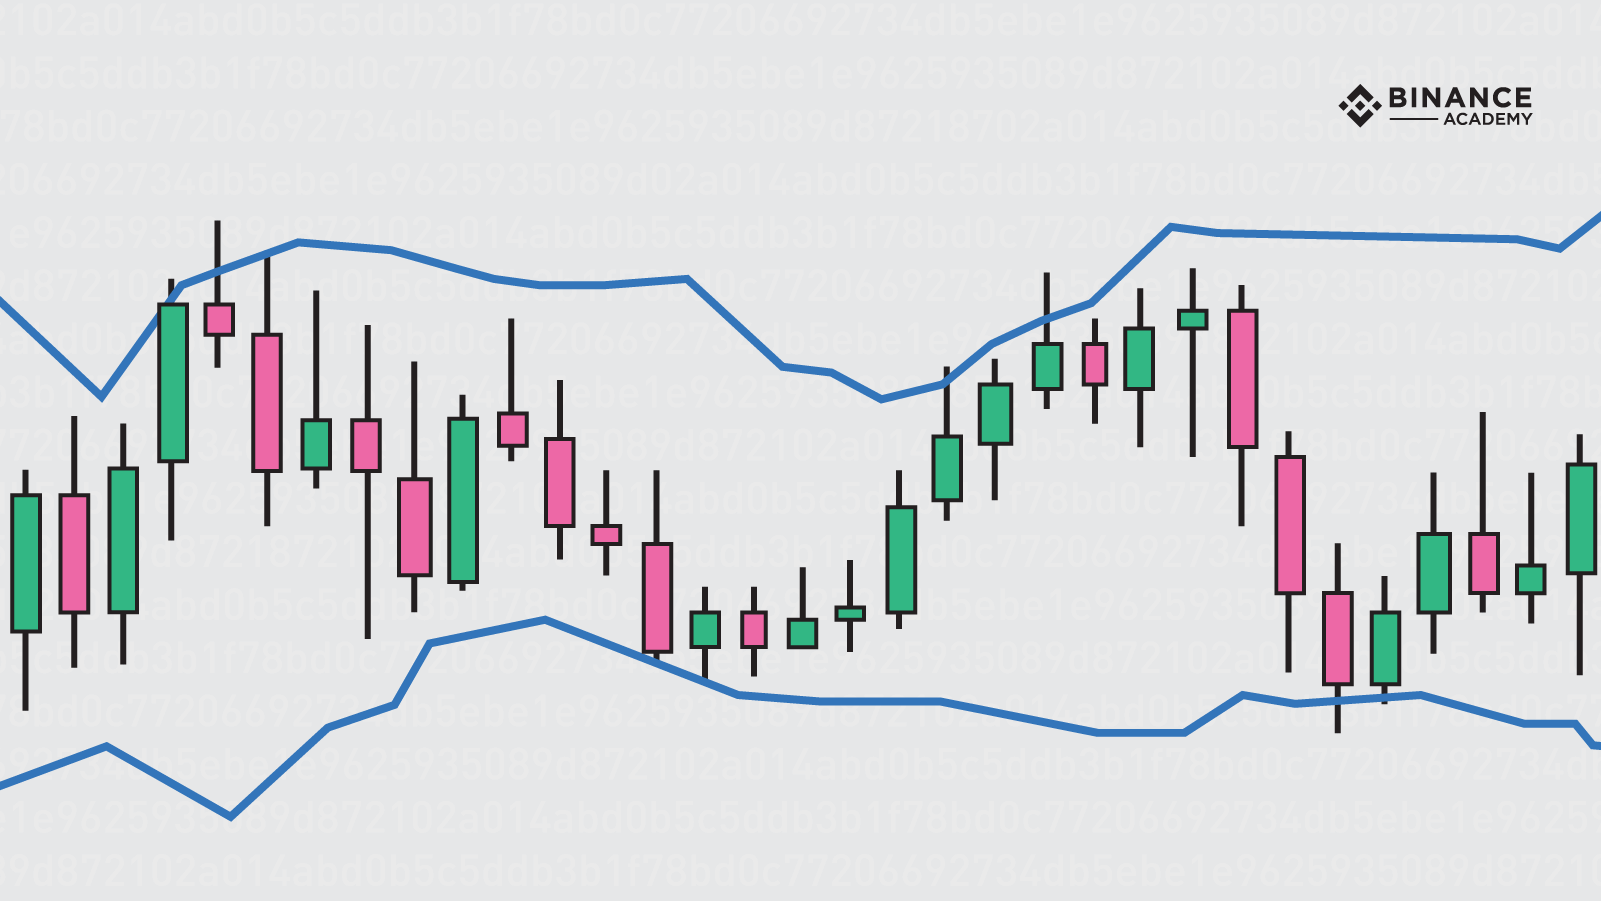
Bollinger Bands consist of a moving average in the middle with two standard deviation lines forming the upper and lower bands. When the price volatility increases, the bands widen, and when it decreases, the bands contract. If the price touches or exceeds the upper band, it may be overbought; if it touches or drops below the lower band, it may be oversold.
4. Relative Strength Index (RSI)
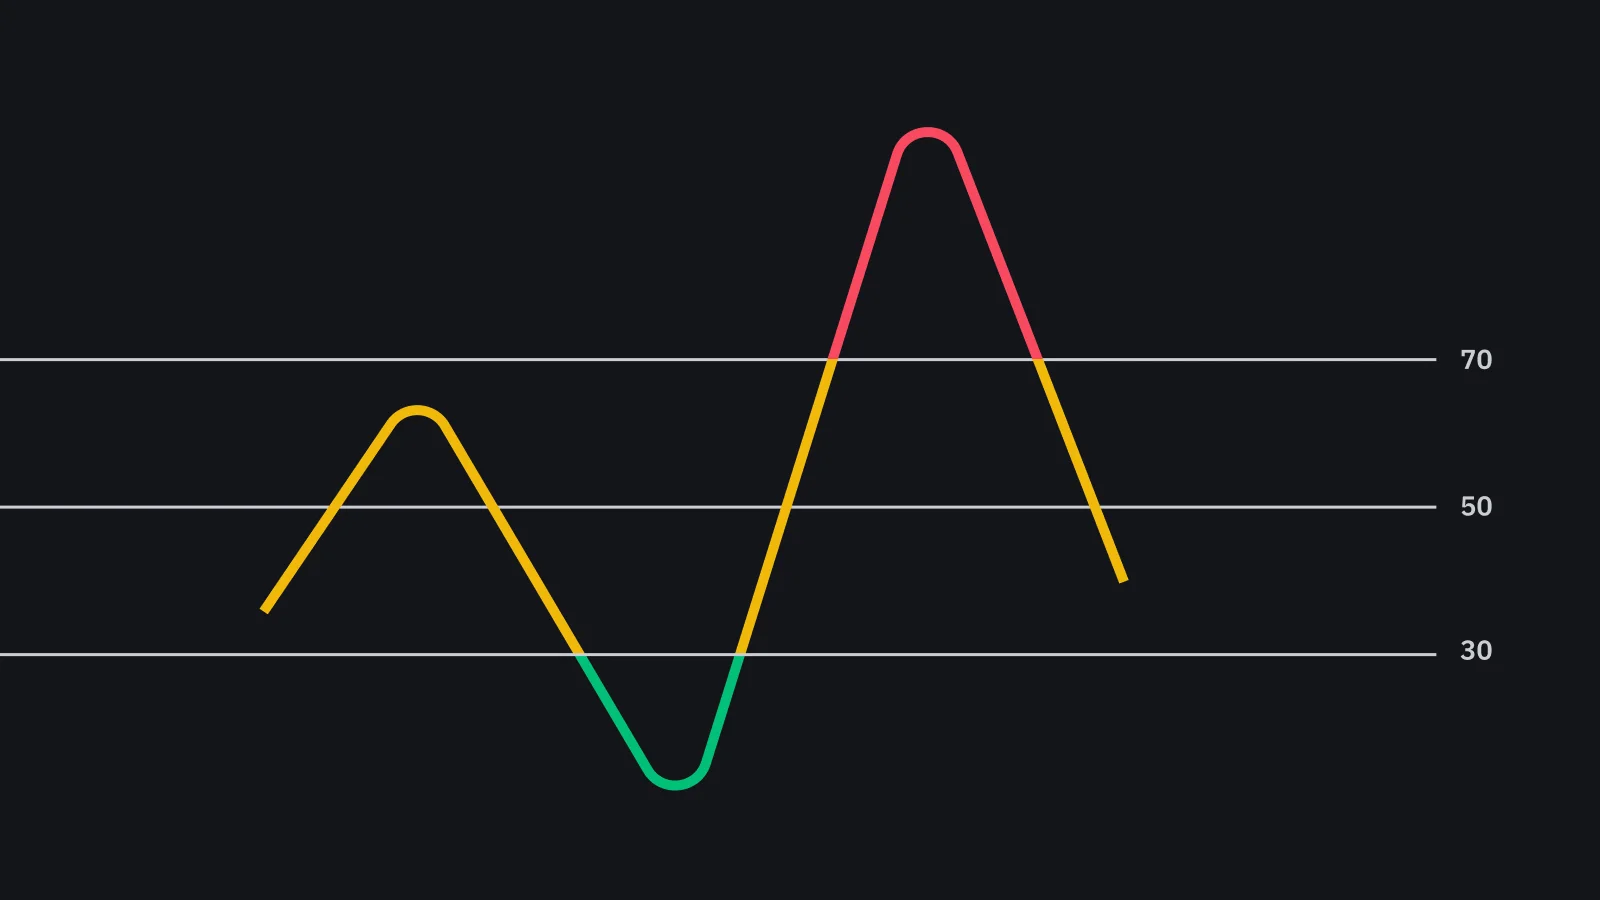
RSI compares the magnitude of recent gains to recent losses over a specified period (typically 14 days) and oscillates between 0 and 100. An RSI above 70 suggests that an asset may be overbought, while an RSI below 30 suggests that it may be oversold.
5. Moving Average Convergence Divergence (MACD)

MACD is calculated by subtracting the 26-day Exponential Moving Average (EMA) from the 12-day EMA. When MACD is positive and rising, it indicates a strong uptrend; when it is negative and falling, it indicates a strong downtrend.
6. Trading Volume
Trading volume reflects the number of shares traded over a specific period. An increase in volume often accompanies significant price movements, signaling strong investor interest in the stock.
Using technical indicators helps investors identify trends and determine optimal entry and exit points. However, it is not advisable to rely solely on one indicator. Combining multiple tools and considering fundamental factors can lead to more accurate investment decisions.
* Sign up for Binance to trade: Here
* Telegram: 3aW Crypto


