Ethereum Price Analysis on March 20: Confirmation of Trend Reversal
Ethereum (ETH) is in a strong uptrend on the 1H timeframe, but it is facing a key resistance zone at $2,050 – $2,100. If the price remains above the EMA50, the bullish momentum could continue. Conversely, if it faces strong rejection, a pullback to the support zone may occur. Let’s dive into the detailed analysis! 🚀
1️⃣ Trend & Market Structure (SMC)
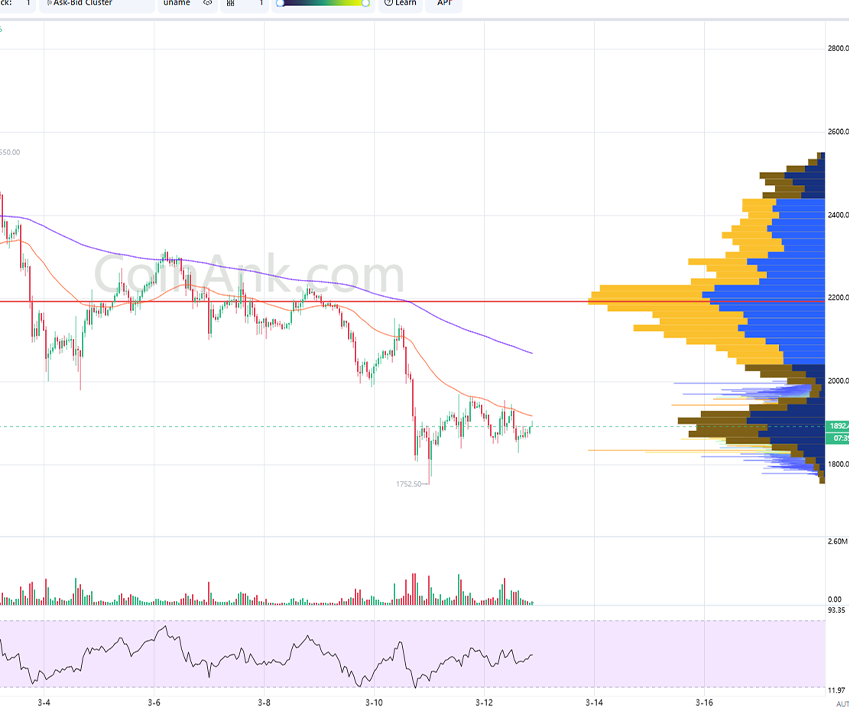
- Main Trend: Bullish, the price has broken out of previous resistance and is holding above EMA200.
- Break of Structure (BoS): A BoS occurred around $1,950, with the price continuing its upward move above $2,000.
- Demand Zone (Support): $1,950 – $1,970.
- Supply Zone (Next Resistance): $2,050 – $2,100.
2️⃣ Volume Profile (VPVR)
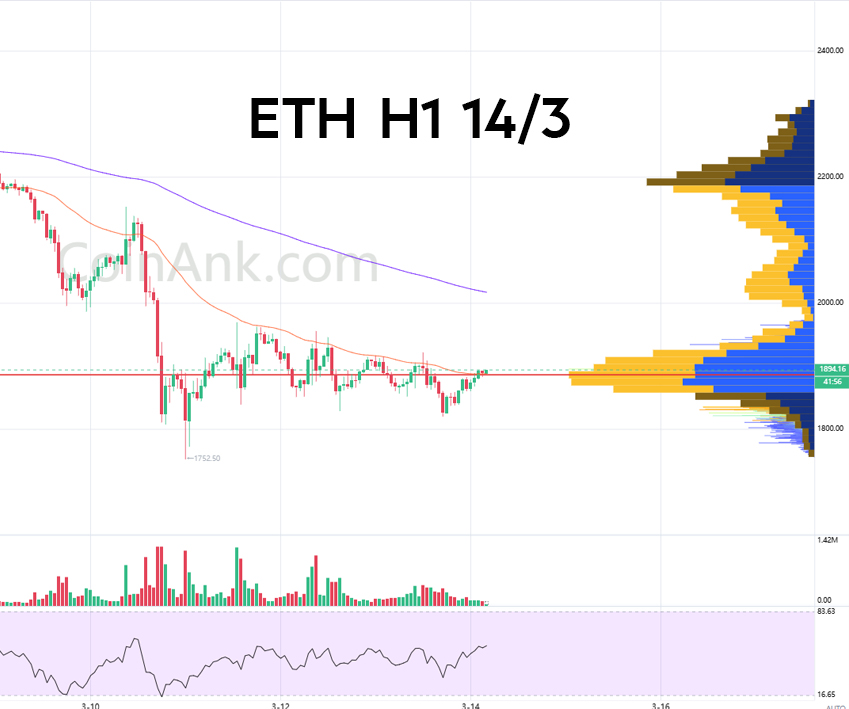
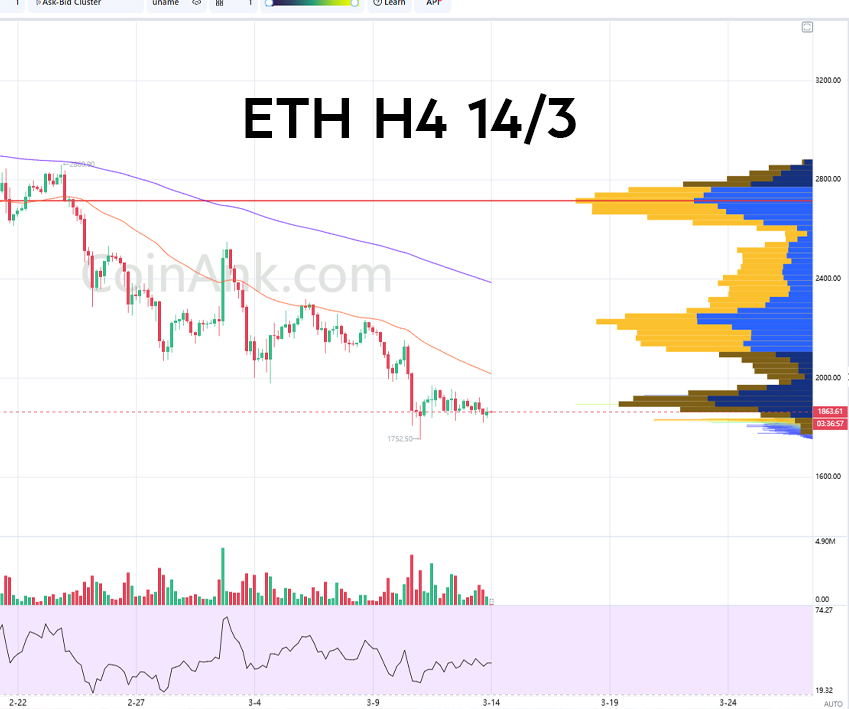
- POC (Point of Control): ~$1,904 (Key Support).
- High Volume Node (HVN): $1,900 – $1,950 (High trading volume zone, supporting the price).
- Low Volume Node (LVN): $2,050 – $2,100 (Price could move quickly if it breaks above this zone).
3️⃣ EMA (Exponential Moving Average)
- EMA200: ~$1,956 – The price is holding above EMA200, indicating a strong bullish trend.
- EMA50: ~$1,972 – A dynamic support level, providing a potential bounce point if the price retraces.
🔹 If the price holds above EMA50 ($1,972), the bullish trend will likely continue.
🔹 A retest of EMA200 ($1,956) without a breakdown could offer a buy opportunity.
4️⃣ RSI & Momentum Signals
- RSI ~75: Currently in the overbought zone, suggesting a possible minor correction before further gains.
- Key Signal to Watch: If RSI remains above 50 after a pullback, the bullish trend remains intact.
5️⃣ Price Pattern
- The price is consolidating after the breakout, potentially forming a Bullish Flag if it doesn’t decline sharply.
- Maintaining above $2,000 could lead to a continuation towards $2,050 – $2,100.
🎯 Trading Strategy
📉 Short Scenario (If Rejected at $2,050 – $2,100)
Entry: $2,050 – $2,100 (Strong Resistance).
Stop Loss: $2,120.
Take Profit:
- TP1: $2,000.
- TP2: $1,950 (EMA200).
- TP3: $1,900 (POC).
Condition: RSI remains in the overbought zone (>75) and the price faces strong rejection with declining volume.
📈 Long Scenario (Preferred if Price Retests EMA50 or EMA200)
Entry: $1,970 – $1,980 (EMA50 Retest) or $1,950 – $1,960 (EMA200 Retest).
Stop Loss: $1,930 (Below EMA200).
Take Profit:
- TP1: $2,020.
- TP2: $2,050.
- TP3: $2,100.
Condition: The price experiences a minor pullback but holds above EMA200. RSI drops to 55-60 without a significant breakdown. Buying volume increases after the pullback.
6️⃣ Conclusion & Next Steps
📊 Trend: Strong uptrend, though signs of consolidation are appearing.
📉 Volume: Slight volume decline after the breakout, suggesting a potential pullback before further continuation.
🔄 Reversal Signals: No clear reversal yet, but watch out for selling pressure around $2,050 – $2,100.
📍 Key Levels to Watch:
- Support: $1,904 (POC) and $1,956 (EMA200).
- Resistance: $2,050 – $2,100.
* Sign up for Binance to trade: Here
* Telegram: 3aW Crypto


